Are Cyber Defenders Winning?
Attackers in cyberspace have long held system-wide advantages. Fighting back requires measuring progress.


On June 6, President Trump signed an executive order to “reprioritize cybersecurity efforts to protect America,” outlining a rough agenda “to improve the security and resilience of the nation’s information systems and networks.” As the administration develops a new cybersecurity strategy, it is essential that it understand and respond to a shifting trend in cyberspace: After a decades-long slump, defenders may finally be gaining the advantage.
In the 1970s, computers could be kept secure simply by being in locked rooms. But when these computers were connected to networks, attackers gained the advantage. Despite decades of defensive innovations since then, defenders’ efforts are routinely overwhelmed by the gains made by attackers. Successful defense is possible—but only with substantial resources and discipline.
Shifting “the advantage to its defenders and perpetually frustrating the forces that would threaten” cyberspace was a central goal of the Biden administration’s U.S. National Cybersecurity Strategy. But how will defenders—flooded with ambiguous statistics—know if they’re succeeding?
As former White House cyber czar, Michael Daniel, expressed, “we are drowning in metrics but still have a lack of measurability.” For example, “Google observed 97 zero-day vulnerabilities … in 2023, over 50 percent more than 2022.” But does such an increase of zero-days, which become known to defenders only when they are used as part of an attack, mean defenders are doing better, or worse? Absent a framework to provide context, metrics proliferate confusion without addressing the problem.
This article, based on the work of an ongoing project at Columbia University involving stakeholders in academia, government, and industry, offers a framework that categorizes—from the vast sea of metrics—the few that shed light on whether defenders are winning by shifting advantages away from attackers. To do so, we first examine what it means to “win” in cyberspace and then conduct a deeper dive into indicators across threat, vulnerability, and consequence (see Table 1).
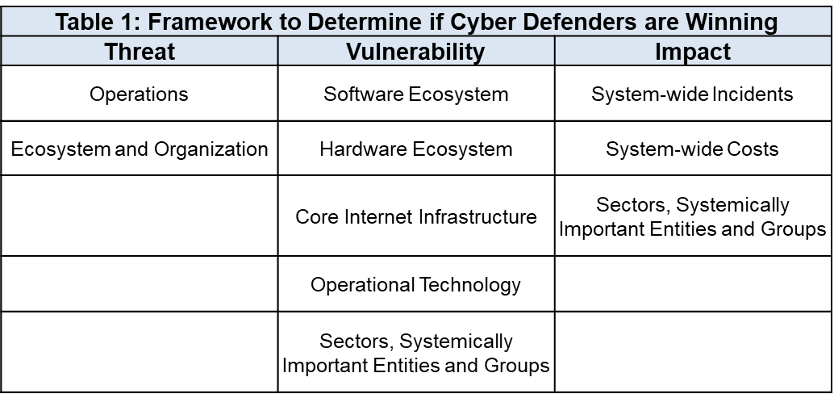
Table 1: Tracking advantage across threat, vulnerability, and impact.
What Is “Winning” Anyhow?
“Winning” in cyberspace can be a hazy concept since, unlike a soccer match, it is an invisible and never-ending competition. The National Cybersecurity Strategy, based on previous work by researchers at Columbia, framed “winning” in terms of whether attackers or defenders have more of the relative, system-wide advantages. Before networking, defenders had the advantage: Lock the door and vet those with access and your computer would be “acceptably resistant to external attack, accidental disclosures, [and] internal subversion.”
But once those computers were connected to others, the attack surface expanded from just the door and people (a manageable problem) to dozens of distant, unguarded terminals (a near-impossible one). The internet exacerbated these vulnerabilities, and as early as 1988 security experts realized that “to a first approximation, every computer in the world is connected with every other computer.” Anyone in the world with a computer and an internet connection could attack what had once been accessible only locally.
Other system-wide disadvantages compounded the problem, each of which is as true now as when first reported decades ago: The design of “hardware and software is totally inadequate to withstand malicious attack” (as reported in 1972); “[t]here are no real consequences for having bad [or] low-quality software” (from 2003); and there are countless single points of failure and common mode vulnerabilities (2003 again)—so that cyberspace is prone to unpredictable, cascading failures.
The result is that only exceptionally well-resourced defenders—the “security one-percent”—have “the personnel, processes, technology, and support to implement somewhat robust digital security programs.” Too many others hover near or below the “cyber poverty line.”
Winning for defenders, for the sake of our project at Columbia, means shifting advantages away from attackers—and making those advantages stick.
There are certainly other definitions of “winning” that have been offered. For example, in an email to the authors, veteran cyber expert Rick Howard reasonably prioritized consequence: Winning is the reduced “probability of any organization getting hit with a material cyber event each year.” The framework proposed in this article is broad enough to accommodate such definitions.
Assessing Existing Metrics and Indicators
Having defined winning in terms of relative advantage, the next question that arises is how to determine if the balance is shifting toward defense. Defenders are flooded with metrics, most of which are not informative of the cyberspace-wide balance between attackers and defenders. Most are geared toward individual enterprises and the chief information security officers who might purchase new security products based on those metrics. These can be excellent, but they say more about how individual organizations are doing, not how everyone is.
Developed with academic, private-sector, and government partners over the past year and informed by our earlier work, our framework presents a rich—though still incomplete—set of indicators that reflect the balance of advantages between attackers and defenders. This work is based on two principles: Rely on data from those who are already collecting it, with scale and quality; and place that data into a context of logical propositions, to present a narrative of shifting advantages over time. These are more than mere indicators, as there is internal logic to each proposition and logic connecting the propositions in each category. To our knowledge, this interconnected logic has not been described as comprehensively before.
Much of this data has issues, but this project is about public policy, not science. It is about identifying trends, not hitting the bullseye. Policymakers can be more confident when diverse sources, each relying on different data sets, tell the same story.
The next three sections center on a fundamental question: What would defenders expect to observe if advantages in threat, vulnerability, and consequence are shifting their way?
Threat
We split the question of threat into two categories: operations, and ecosystem and organization.
Operations
The goal of the National Cybersecurity Strategy—which here, we adopt—is to disrupt threat actors so that they are “incapable of mounting sustained cyber-enabled campaigns.” Defenders can determine whether that is the case with the following propositions:
- Adversaries need to shift from easier to harder tactics, techniques, and procedures (TTPs); that is, they can no longer simply steal or use legitimate login credentials but are forced to actually hack. Fewer incidents rely on tricking a human, such as clicking a link.
- Adversaries need to rapidly update their TTPs, as these are being routinely upended by defenders.
- Attackers must constantly rebuild their infrastructure, which is frequently dismantled by defenders.
- Because vulnerabilities are patched so quickly by defenders, attackers cannot keep exploiting the same ones year after year. There is rapid turnover of vulnerabilities and a related increase in the number and price of zero-days.
- Adversaries are more quickly detected and ejected from their footholds within enterprises.
- More enterprises (and their key security vendors) detect adversaries themselves without relying on external notification (such as from law enforcement or the attackers themselves).
There is sufficient data across these indicators to point to a far more optimistic assessment than suggested by dystopian headlines. To start with, the 2025 Verizon Data Breach Investigations Report shows three separate improvements. Since 2021 adversaries have shifted from easier to harder TTPs (see Figure A), a finding backed by Mandiant using a different data set. Verizon also reported a roughly 25 percent decrease in breaches that depended on tricking a human to make a mistake. Over the past few years, internal detection of breaches has risen, though external notifications remain the norm, according to Verizon (see Figure A), IBM, and Mandiant.
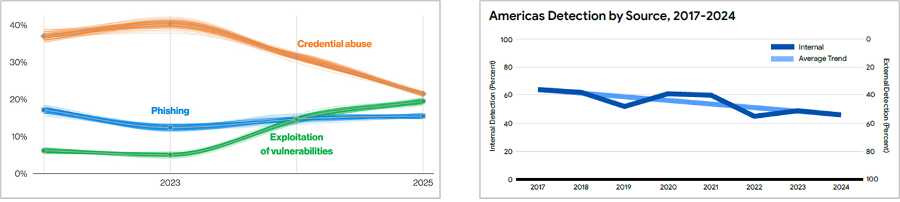
Figure A: Graphs from Verizon showing the shift from easier to harder TTPs (2025) and an increase in internal detections (2024). Both are positive trends, confirmed by another cybersecurity company, Mandiant.
Mandiant reports a tremendous drop in the time it takes enterprises to detect and eject threat actors, from 400-plus days in 2011 to just a dozen or so today. This finding holds even when controlling for ransomware attacks (which want to be detected, at some point) and is supported by separate reporting from Verizon and SecureWorks (see Figure B). IBM reports a decrease, but not nearly of this scale.
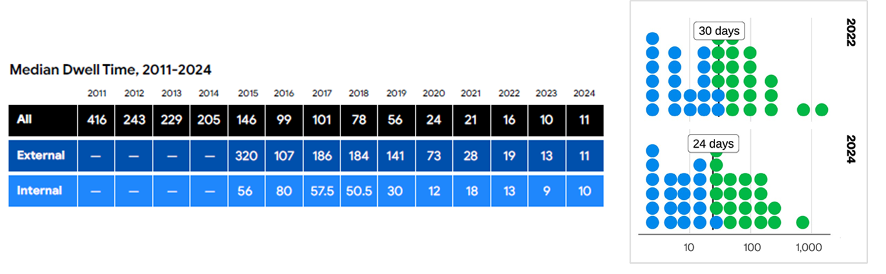
Figure B: Relying on different data sets, Mandian (2025) and Verizon (2025) both found substantially decreased "dwell times" of threat actors in defenders' systems. Adversaries are being detected more quickly.
Though the number of actively exploited vulnerabilities has held relatively steady since 2017, Google reports that zero-days constitute a growing majority (from roughly 62 percent in 2020 to 70 percent in 2023). This may be driving up the total number of zero-days detected per year by 50 percent, as well as the price, according to Crowdfense.
Another positive sign is that, perhaps because companies are patching more quickly (see below), adversaries are being forced to exploit newly disclosed vulnerabilities far more quickly, dropping from 63 days in 2018 to just five days in 2023, according to Google.
Organization and Ecosystem
Tracking whether the adversary organization and ecosystem has been substantially disrupted has a similar set of logical propositions, though these need to be further developed:
- If defenders are succeeding, then threat actors have lower profits.
- As a consequence of lower profits, threat actors become consolidated into larger, more capable groups, with smaller players going out of business.
- There is decreased trust between threat-actor groups, as they are targeted and infiltrated by law enforcement and other defenders.
- Threat actors struggle to find talent, as it is seen as a far-too-risky career path.
These might be more difficult to observe and measure than the statements in the operations, but there are some obvious leads. For example, reporting in early 2024 found that ransomware gangs were struggling, “recruit[ing] highly skilled (and scarce) contractors” and “almost desperate in terms of the ability to continue operations.” Until supported by data across all the related propositions, these anecdotes are useful but not sufficient.
If the propositions described in this section are correct, adversaries may be forced by improved defenses to operate faster, more expensively, and perhaps less efficiently, just as called for in the White House strategy. After all, “attackers have bosses and budgets too.”
But if adversaries are having a harder time, why does it still feel like defenders are falling “increasingly behind”? The assessment offered above is certainly incomplete. And, as explored below, reductions in threat are not—yet, at least—leading to reduced consequences.
Most important, “imposing costs” leads to a survival-of-the-fittest contest, leaving fewer but fiercer predators. Unable to compete, the weakest adversaries will go “extinct,” forcing those remaining to become ever more agile and dangerous. Defenders must continue to adapt and disrupt just to keep pace—what biologists term the Red Queen effect.
Vulnerability
Here, we go into depth about only one area of vulnerability—the software ecosystem—although that is likely no more important than the hardware ecosystem; operational technology; core Internet infrastructure; and sectors, systemically important entities, and groups.
The propositions for a securely designed—and therefore less vulnerable—software ecosystem include the following:
- Vulnerabilities that are less severe and less easily exploited by adversaries.
- As software vendors improve their processes, vulnerabilities will be more diverse. That is, no single category of vulnerabilities will be over-represented—as memory-unsafe vulnerabilities have been for decades, representing 70 percent of vulnerabilities that Microsoft fixes.
- As end users patch more quickly and at scale, vulnerabilities will be less stubborn, reflected in, for example, a decreasing average age of vulnerabilities used in active exploits.
- There will be a reduced tail of abandoned code, still used in critical infrastructure but no longer supported with security updates by the vendor.
Based on these admittedly non-exhaustive indicators, our team again found greater-than-expected reason for optimism. Veracode, which annually reports on the state of software security based on results from their scanning tools, found a huge jump in applications without a flaw in the OWASP Top 10 (a “broad consensus” of “the most critical security risks to web applications”), which improved only slowly from 2010 to 2020 (from 23 percent to 32 percent) only to boom since then (from 32 percent in 52 percent in 2025). Over half of the software they scan lacks obvious, major mistakes.
In fact, Veracode last year reported that “every measurement” of security improved “over the last six years,” including 30 percent reductions in the number of applications with high-severity flaws and in software without a “flaw in an open-source library when they are first scanned.” These trends continued in their latest report (see Figure C).
Cobalt, a company that conducts penetration tests, found similar, substantial improvements in how companies patch bugs: “[T]he median time to resolve serious vulnerabilities has decreased dramatically—from 112 days [in 2017] down to 37 days last year” while the proportion of serious findings discovered in penetration tests “declined by about half,” from 20 percent to 11 percent.
Moreover, Google has reduced by half the number of memory-safe vulnerabilities in Android, also in Figure C, while data from the Exploit Prediction Scoring System, analyzed by Veracode, shows a 50 percent decrease in exploitability from 2020 to 2025, suggesting that the more severe flaws are being caught and fixed before the software is released.
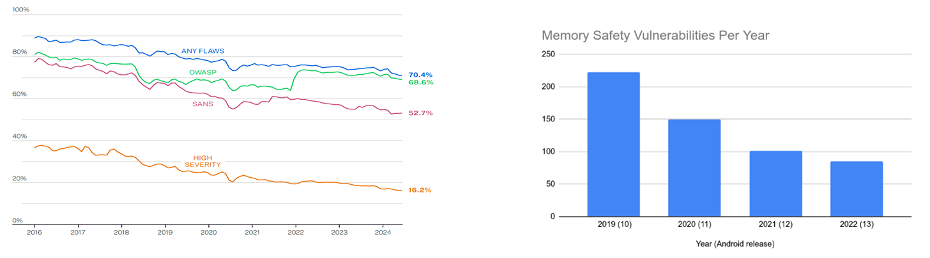
Figure C: Veracode (left, 2025) has reported improvements of every measure of software security, including a decrease in high-security vulnerabilities. Google (right, 2023) has reduced vulnerability by substantially decreasing the number of memory-safety vulnerabilities.
Software is becoming more secure, with improvements across the software development lifecycle. Lacking a sufficient framework with which to conceptualize these improvements, this remarkable insight has not received much attention.
Consequence
Reducing threat and vulnerability are important but matter little if consequence doesn’t follow. Unfortunately, in terms of incidents and costs, the data does not seem to reflect these reductions (we have not yet analyzed for sectors, systemically important entities, and groups).
Incidents
Metrics for incidents have often mistakenly focused solely on the raw number of them. If defenders are more successful, there should be a decrease across a wider set indicators:
- Fewer overall cyber incidents.
- Fewer records stolen in each incident and in aggregate.
- Fewer one-on-multitude and cascading cyber incidents. The most serious cyber incidents rarely punish just one victim (like North Korea’s attack against Sony Pictures Entertainment in 2014), but thousands or tens of thousands at once (such as with the SQL Slammer, NotPetya, or SolarWinds incidents). As defense improves, these should become rare.
- Fewer national-security-relevant incidents. Even if economic costs are decreasing, the consequences may still be high if the remaining incidents have greater national security effects.
Costs
There should similarly be a decrease in various costs:
- Reduced monetary losses from individual cyber incidents and cumulative economic impact.
- Fewer catastrophic cyber incidents. There should not just be fewer incidents and lower losses, but fewer high-cost incidents.
- Fewer direct and indirect deaths from cyber incidents.
Oddly, given that it is the most critical indicator of consequence, there seems to be no solid data on the overall number of deaths.
Of the existing, available indicators, only one is obviously decreasing: insurance payouts for catastrophic cyber incidents. Other indicators, such as losses from ransomware, are mixed.
Cyentia reports an increase in losses from ransomware events, with “even the ‘smaller’ losses” getting “substantially bigger,” as shown in Figure D. Chainalysis found that while the number of victims is at or near record highs, total ransomware revenue was 35 percent lower in 2024, “driven by increased law enforcement actions, improved international collaboration, and a growing refusal by victims to pay.” Microsoft found a similar trend.
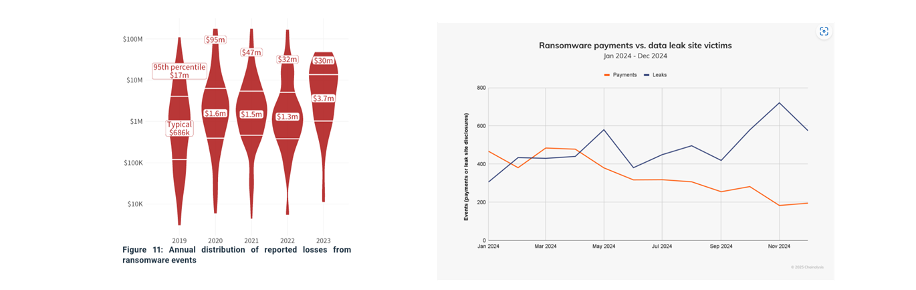
Figure D: Even while each ransomware loss is growing in size according to Cyentia (left, 2024) and affecting more victims, the overall revenue to ransomware groups has decreased, per reporting from Chainalysis: "More victims were targeted, but fewer paid." (right, 2025)
Cyentia, in an upcoming report in their IRIS series, also found mixed consequences: Over the past 15 years, reported incidents each quarter have increased 650 percent, though unevenly so. Since 2008, the largest companies (the “security one percent” mentioned above) are a third less likely to experience an incident, while small businesses are two times as likely (see Figure E).
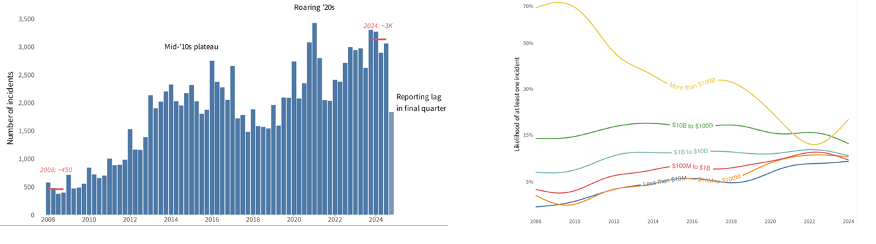
Figure E: Cyentia reports substantial increase of all kinds of incidents since 2008 (left, 2025) though this is unevenly distributed. Enterprises with the highest revenues (over $1 billion) are less likely since 2008 to have at least one incident, smaller companies are more likely (right, 2025).
There has been a steady increase across most other categories, such as losses and number of cybercrime complaints to the FBI and growth in estimated total losses from cybercrime, a trend confirmed by IBM, as shown in Figure F.
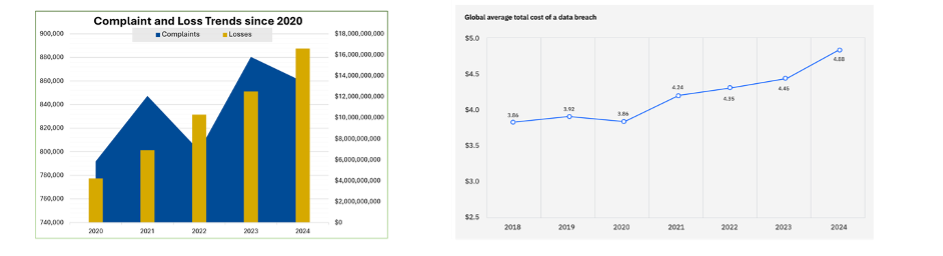
Figure F: The FBI reports a sharp increase in total losses but a decrease in total complains (2025, left), while IBM Is tracking an overall steady increase in the costs of a data breach (right, 2025).
Among these troubling trends, Cyentia found that, since 2008, companies are reporting 6.5 times more incidents each quarter, a typical firm is 3.7 times more likely to have an incident, median losses per incident are 15.2 times higher, and median losses relative to a firm’s revenue are nearly eight times higher (in constant dollars). Some of Cyentia’s graphs, from their latest IRIS report, are in Figure G.
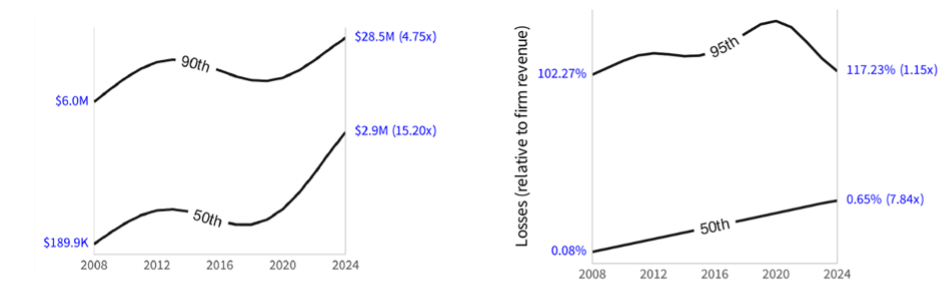
Figure G: Cyentia further found a 15 times increase in median losses from a security incident (left, 2025) and a nearly 8 times increase in losses relative to firm revenues.
Determining if the defense is winning must also rely on nontraditional metrics, such as negative credit events like downgrades due to corporate cyber incidents. Moody’s has shared with Columbia the growth in those events, as shown in Figure H.
Another nontraditional metric hints at increasing national security impact: The number of declared emergencies by a nation or a U.S. state. As shown in Figure H, no emergencies were declared before 2015, but there have been a growing number since, with most declared to mitigate impact to energy distribution from the Colonial Pipelines ransomware attack.
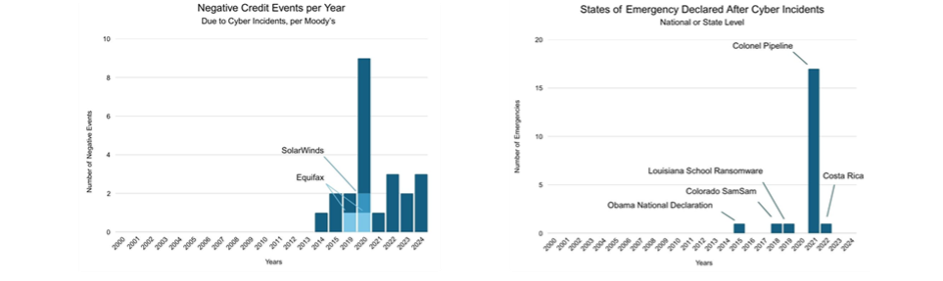
Figure H: Moody's reports an increase in negative credit events due to cyber incidents (2025, provided to authors) while public reporting shows a major increase of declared states of emergency due to cyber incidents (co-authors, 2025).
Other hints of increasing national security consequences come from the number of incidents leading to a high-level Deputies Committee of the National Security Council. During one of the co-author’s time at the White House, from 2003 to 2005, there were few if any incidents demanding such a lofty response. That has changed; for example, the consequences of the Change Healthcare ransomware incident of 2024 required daily meetings of the Deputies Committee for more than a week to manage the situation. This is not just a U.S. issue; in 2022 a majority of the United Kingdom’s equivalent COBRA meetings were “convened in response to [ransomware] rather than other emergencies.” These numbers could be improved if the U.S. government would report a time series of how often it declared a “significant cyber incident.”
Next Steps
Despite some progress in reducing threat and vulnerability, the consequences of attacks seem to remain stubbornly high.
Our project is proceeding in three phases—the initial framework presented here is only phase one. In phase two, the goal is to create a more complete catalog of indicators across threat, vulnerability, and consequence; encourage cybersecurity companies (and others with data) to report defensibility-relevant statistics in time-series, mapped to the catalog; and drive improved analysis and reporting.
Future White House reports to Congress on the U.S. cybersecurity posture should use this framework—or one like it—to report the advantages made by defenders, perhaps driven by Cyentia’s regular IRIS reports for the Cybersecurity and Infrastructure SecurityAgency. This framework should also be useful for analysis of systemic risk, including for insurance and reinsurance.
In a third phase, this project will produce an annual report on progress and evolve from indicators to desired future states: for example, to “reduce global mean-time-to-detect from days to under 24 hours.”
***
Gross domestic product and emissions of carbon dioxide (CO2) used to be directly correlated. Now, given substantial investment, some economies are able to grow their economies with far less pollution. Defenders can set a similar goal to decrease the number and intensity of cyber incidents even as technological connectivity increases. Just as headlines now discuss “peak CO2,” it is possible that we will read about “peak cybersecurity spending” or “peak incidents” in the future as more information technology is deployed globally and these figures decrease.
Winning in cyberspace is possible by consistently shifting advantages from attackers to defenders, an effort attracting hundreds of billions of dollars every year. The spending to measure the success of this investment amounts to less than a percent of a percent of that. Measuring if defenders are making any progress in shifting the disadvantages of the past decades is vital to ensuring progress.

.jpg?sfvrsn=5d0f4c8e_5)